Send an email to Michael Nielsen
På svenska, tack
Evaluation
We always ask the participants in our courses to make an evaluation based on standardised questions of multiple-choice type. The graph on the left shows how participants perceived SPC – in plain language when they answered by choosing the attributes that they felt best matched the nature of the course. It is worth noting that very few (about 2%) thought the course was difficult, and that more than half felt that the course had quality (55%) and that the knowledge it imparted was useful (75%).

Impressions.
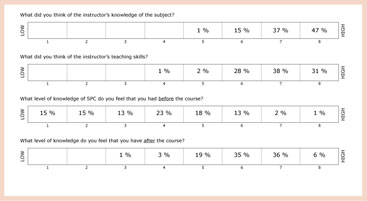
The graph on the right describes the participants’ impressions of how the course was run and their own assessments of how much they knew about SPC before and after the course.

Other examples of comments from participants were: Easy to learn, good pace and not too long. Real-life examples. Realisation of what it means to “measure” a process Interesting, important and relevant information. Instructor easy to understand. Not much in the way of figures and calculations. Gave greater understanding of the subject.

LAST UPDATED 20 SEPTEMBER 2016
Download »
Download
Download »
Download
« About the course